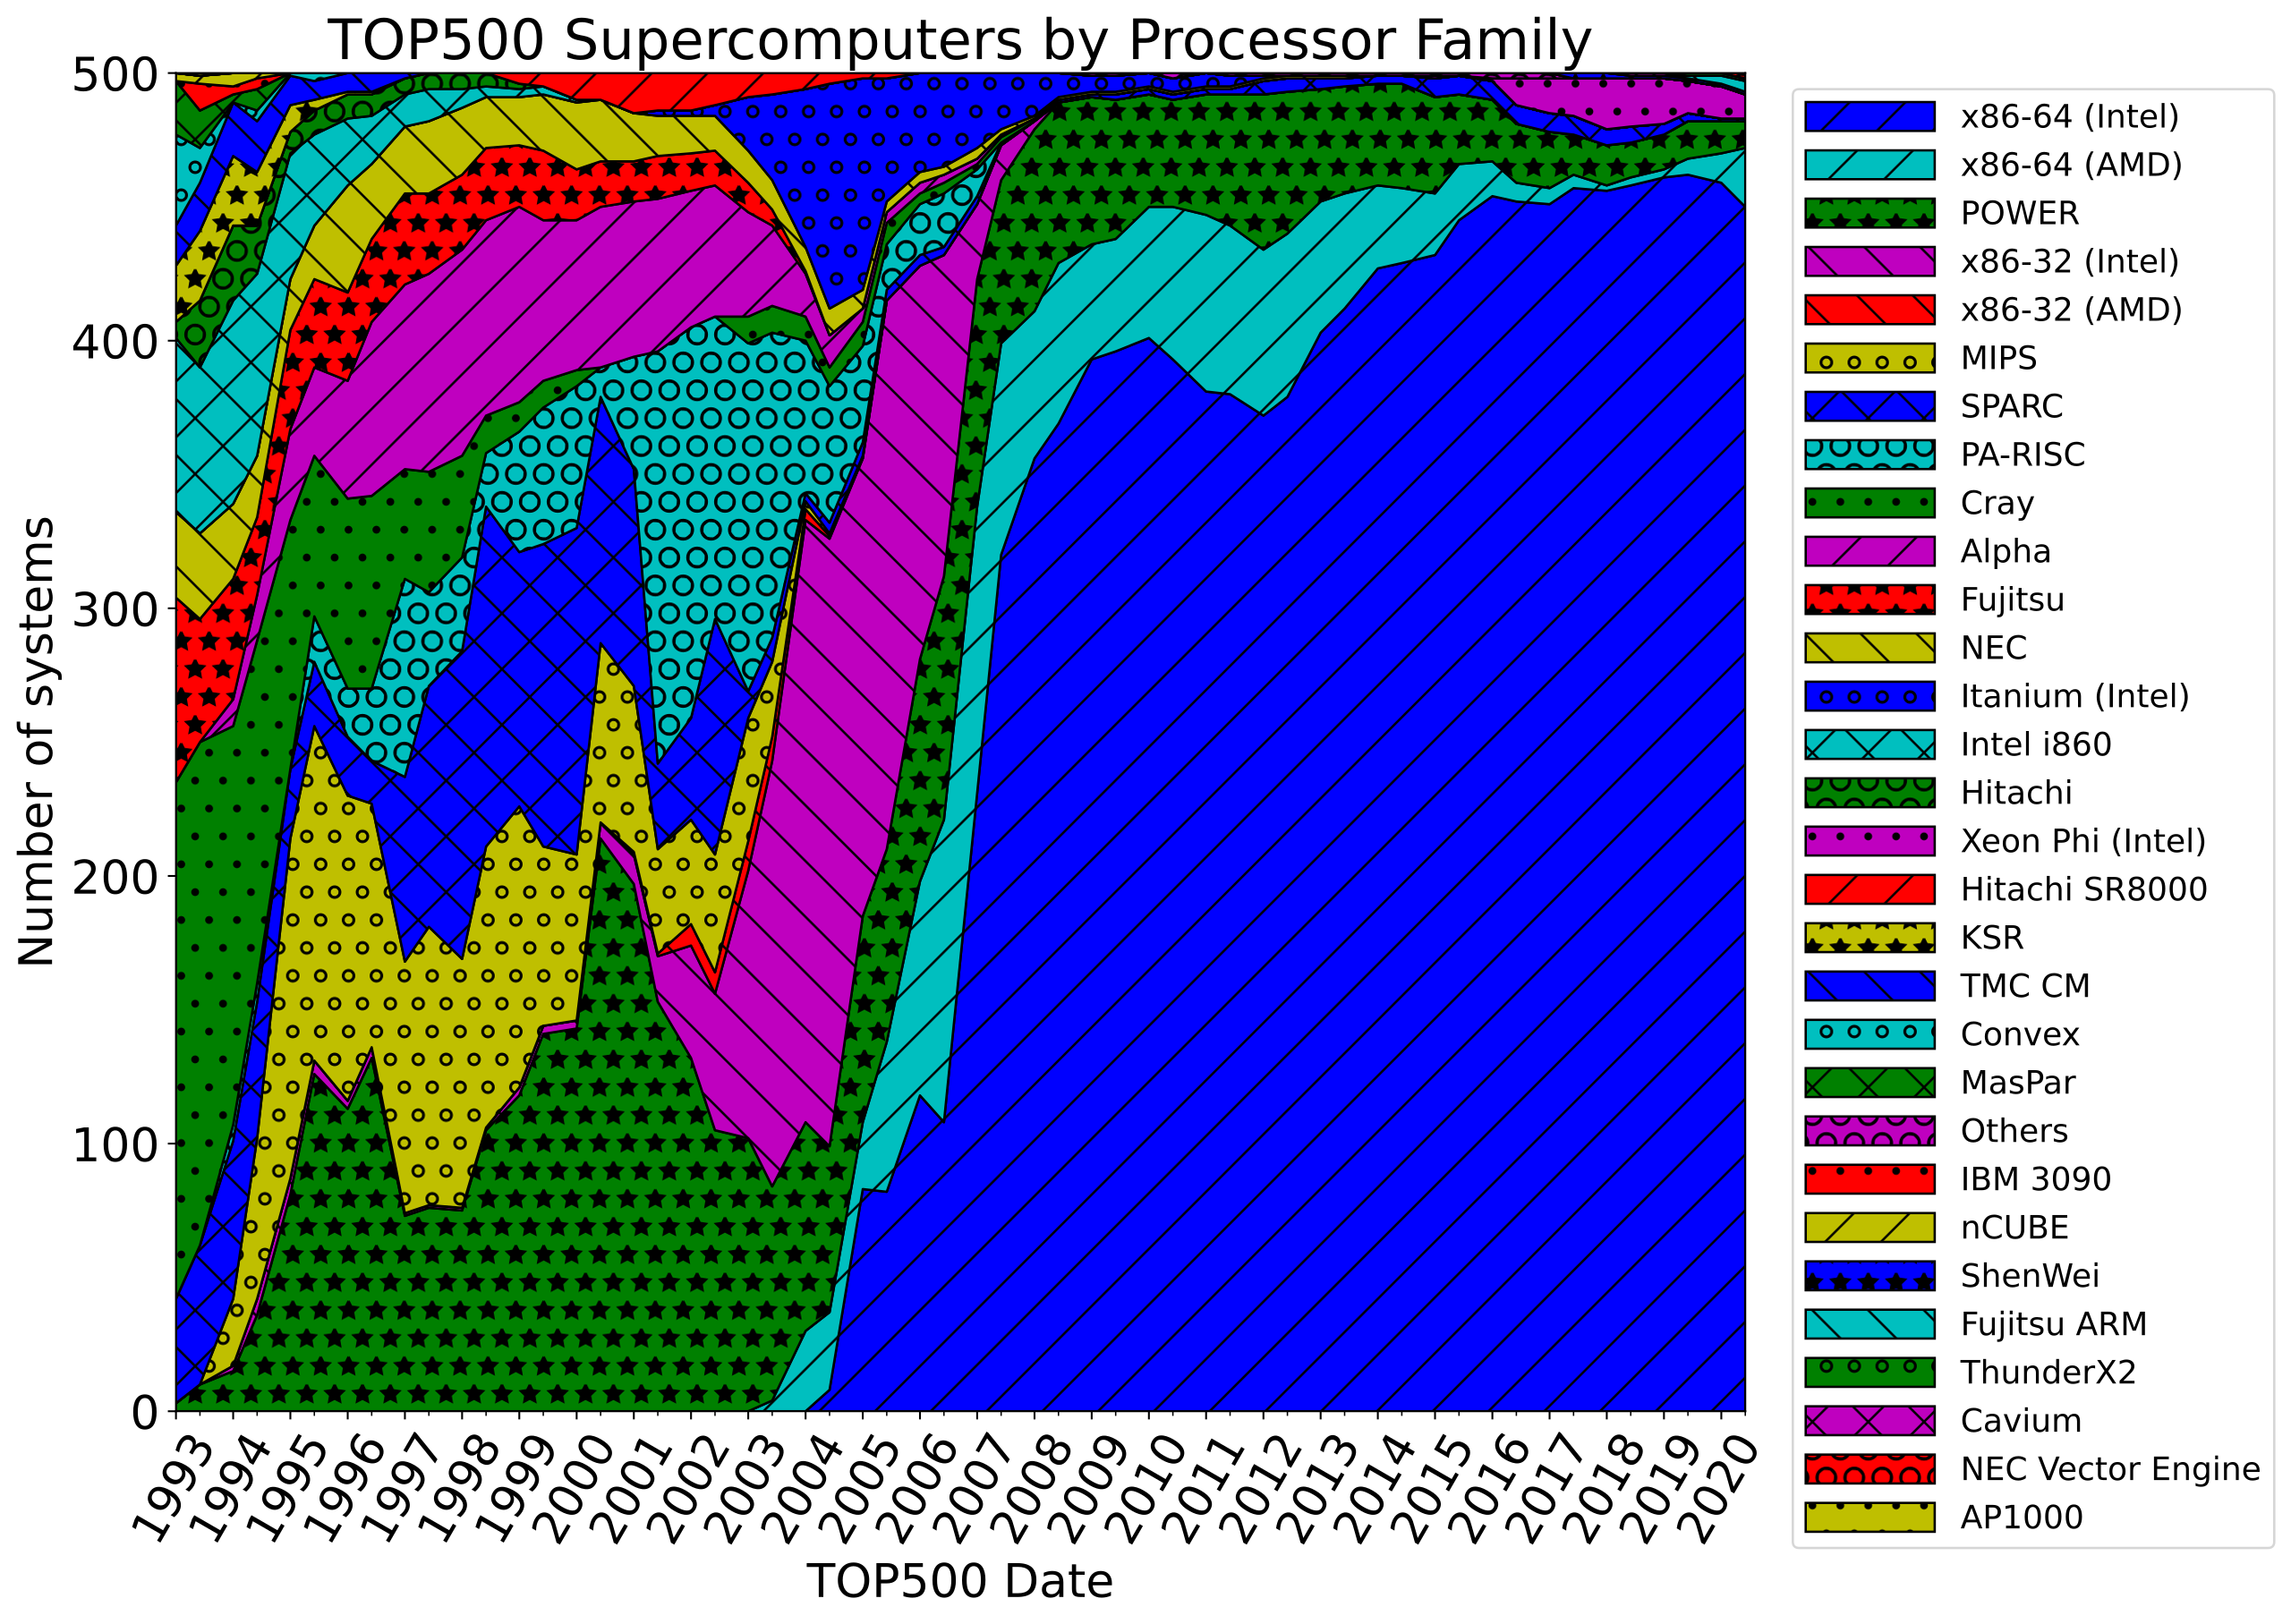
Can I just point out how much I hate those sand charts? You can only tell what the bottom most variable is doing.
How big is the AMD segment when intel was rapidly rising? You can't tell because slope hides line width. Want to know the trajectory of the other small players? Too bad.
I can see all 23 trends in the sand chart at least. 23 lines on a line chart would be nothing but visual noise to me. I can barely parse the line charts on TIOBE which have only 10 lines.
Stacked chart makes sense here, because the sum is constant.
What does not make sense is slanted lines; they draw different, slanted shapes that don't convey information.
Instead, a stacked bar chart would be appropriate.
It's also hard to offer so many distinct saturated colors, and color + pattern does not work all that well for small slivers like IBM 3090. A palette of appropriately contrasting colors (different hues, intensities, and saturations) would work better.
That would still be a mess, in mostly the same way. All it does is emphasize that the values have a coarse 1-year sampling rate.
The real mistake is that the most rapidly-changing values should have been in the middle, with the slowly-changing values at both top and bottom. This would help align the values from one sample to the next, making them easier to follow across the chart.
I wonder if the x86 dominance has declined slightly since 2015 - I know the #1 supercomputer is currently a POWER machine, and there have been some Chinese supercomputers that use their own manycore cpus with what I think is a MIPS-inspired ISA
It hasn't declined any more than pepsi and coca cola have declined, and there's no reason to believe it ever will. MIPS is gone. Power architecture being open sourced likely means IBM no longer has a business interest in it. This is what business folks call shakeout. It's what intellectuals would call the "end of history" for the microprocessor, similar to the fall the USSR. Big money research has moved on to quantum processors.
Speaking as someone who's an avid reader of open source codebases, I kind of wish more of my colleagues would accept this, because it really stymies progress in open source that folks continue supporting huge amounts of code that today are mostly only used by folks doing things like emulating Sega Saturn on an FPGA for fun.
they've been generally competitive (probably much more so when you factor price in). Now, with Rome having come out, their market share is supposedly increasing quite rapidly, since apparently it trounces Intel's Xeon offerings.
Anecdata, but I have a calibrated screen with about 95% AdobeRGB coverage, and the dark boxes and lines are very clearly distinguishable. Is your screen calibrated? Is something off with your contrast setting? Maybe a very bright backlight ruins the contrast ratio at the darker end?
(I agree, however, that it's not a very attractive color scheme, and not a terribly informative graph anyway. A simple X-Y plot would be better.)
These screens are factory calibrated (supposedly, but they included a colorimeter report in the box) and they're all consistent several years later so I'm guessing so. Maybe its gamma? Or maybe you're on OSX? (IIRC apple devices use gamma 2.2 by default and Windows does 1.8? I think?) Our difference could totally be because of default gamma.
I'm on Linux, and my gamma is calibrated to 2.2. 1.8 sounds way too low, I think! sRGB is roughly a 2.2 gamma curve, and a lot of professional media is done for screens expected to have a gamma of 2.4.
Given that the future of at least a subset of HPC is spreading out super parallel calculation to lots of GPUs via fast interconnects, it is certainly conceivable that ARM based systems can do that as well as x86 system.
Don't use sand charts kids.