Why spend a month of computer time to evaluate all one billion images? A randomly chosen million would seem to give you excellent data, more than enough to make the statistical conclusions the article talks about. Maybe you'd run the chance of misrepresenting large-scale commercial installations, but you could correct for that manually, and that's already a risk since the methodology skips some rural areas. Maybe it's simply good advertising to say you did the whole thing. But more likely the real purpose of the survey is to sell the gathered information at a much more granular level: zip codes, streets, or better still, individual households.
What's the usefulness of analyzing just a random sample? They need to analyze 1 billion images so they have granular data on what % of homes in specific zip codes, towns, etc have solar panels installed. This is actionable data. IE. if there's lower % usage in a specific zip code, they might implement some action to improve it in that specific zip code.
So of course, the value is all in the granularity. They already trained the model on random images.
If you can figure out exactly where the residential rooftop panels are, you’ve found a goldmine of people susceptible to door-to-door sales of “get 10% returns guaranteed per year by letting us sell you/install/use your ______”.
> I think your speculation about monetization is unfounded.
I think it isn't bad speculation at all - I used to work in the energy industry as a data scientist and I know there are several US energy companies working on this exact problem.
I'm not sure that sampling would work in this case. There's a real risk, IMO, of ending up with sampling bias.
For example, some communities are very anti-solar and the local "homeowners" association blocks them. Others are favorable and approve them everywhere having relatively high density.
Maybe there's a way to account for this, but I'm afraid that the clustering of installs might cause issues.
EDIT: And, to go to your final point, yes, I suspect one goal is to be able to provide really accurate data at a zip code level. I can imagine lots of useful reasons for that, some related to what I said above, too.
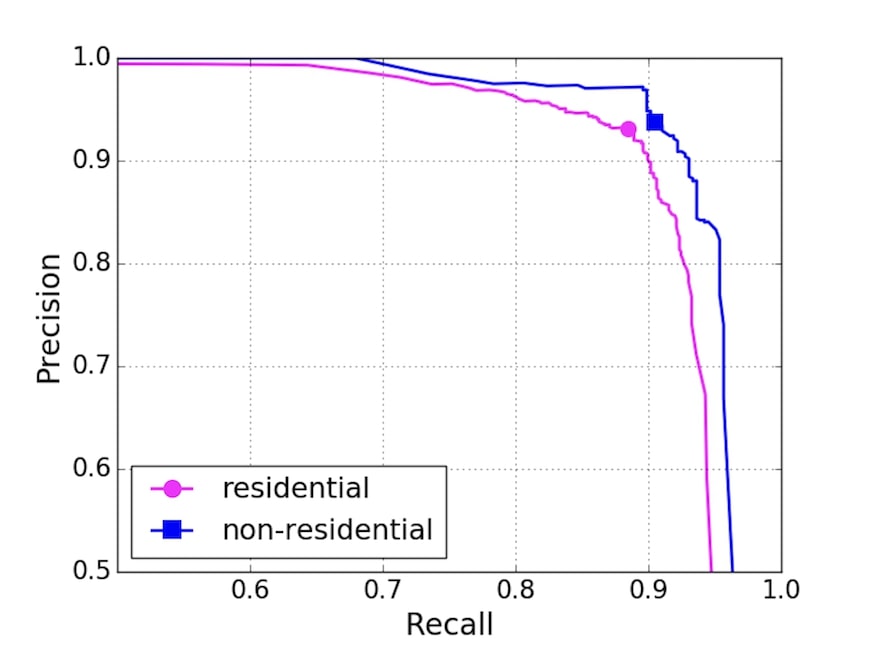
> As DeepSolar learned to identify the characteristics of panels in the images, the system was eventually able to correctly identify that an image contained solar panels 93 percent of the time. About 10 percent of the time, the system missed that an image had solar installations.
How can these two facts both be true? If it fails to identify that an image contains solar panels 10% of the time, then it can't possibly correctly identify that an image contains solar panels greater than 90% of the time, and that would require that it has a 0% false positive rate. I can only assume they mean that it has a 7% false positive rate and a 10% false negative rate, but that is ... not what the first statement says at all.
Precision is what percent of the identified-positives are actually positives: true-positives / (true-positives + false-positives).
Recall is what percent of the actual-positives were identified as positive: true-positives / (true-positives + false-negatives).
These are useful summary stats over the true-false/positive-negative matrix because, to quote the wikipedia: "In simple terms, high precision means that an algorithm returned substantially more relevant results than irrelevant ones, while high recall means that an algorithm returned most of the relevant results."
I've been curious about using machine learning + satellite images to do sales prospecting. Grab neighborhoods and map the locations of people's pools, or certain types of roofs, or size of yards. Spit out a list of addresses and send them a flyer. Not sure if searching public records would be faster/cheaper.